Skip to content
RoboCare
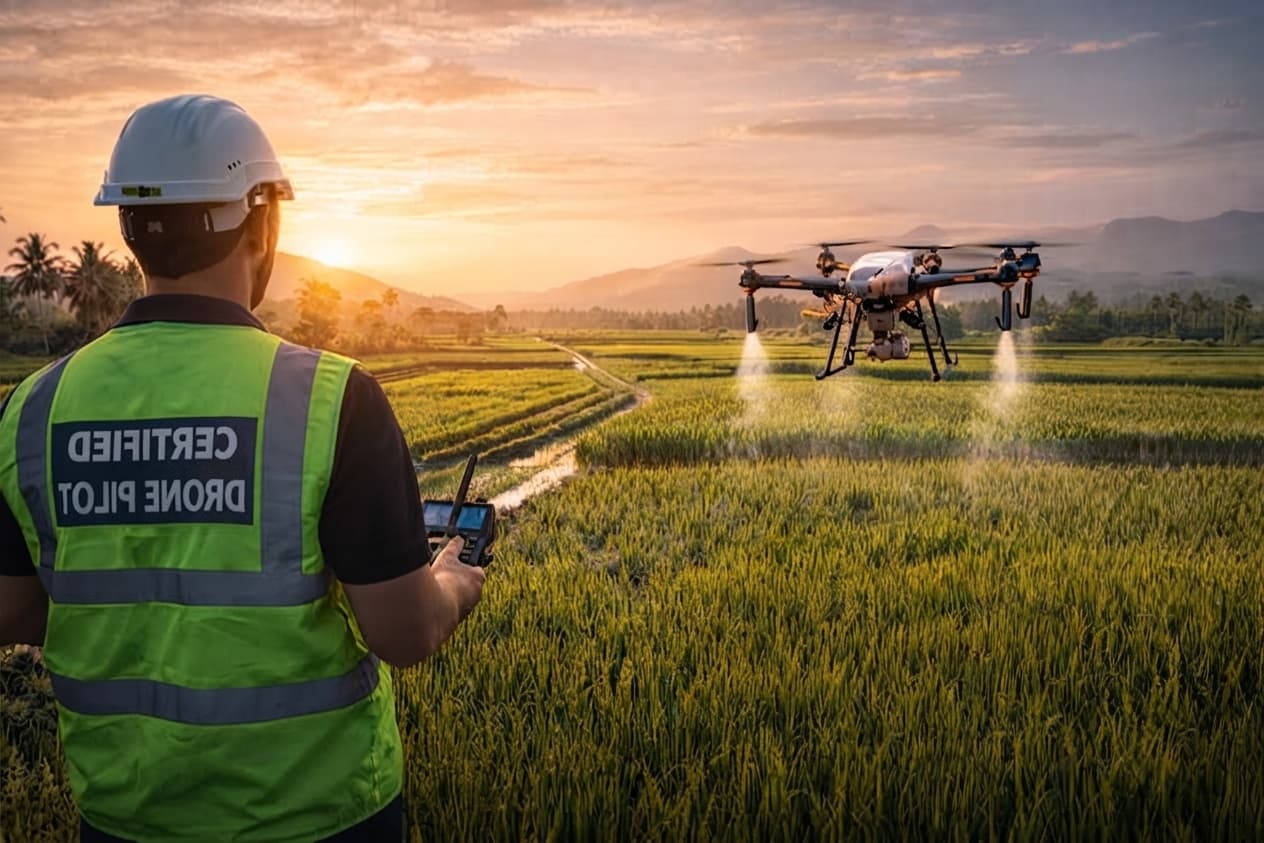
RoboCare multispectral drone flying over a field

Technology

Four technologies, one decision chain

Satellite, ground sensors, drone and artificial intelligence: each building block answers a precise observation scale, from region to tree.

Satellite revisit

5 days

Drone resolution

Centimetric

Precision agronomy

Zone by zone

Data science

Every season

Artificial intelligence

01

Models trained on Mediterranean time series, not on data imported from another climate.

Retrained every season
  • Image segmentation to delineate stress zones
  • Yield forecasting models per crop
  • Disease classification from field images
Satellite technology

02

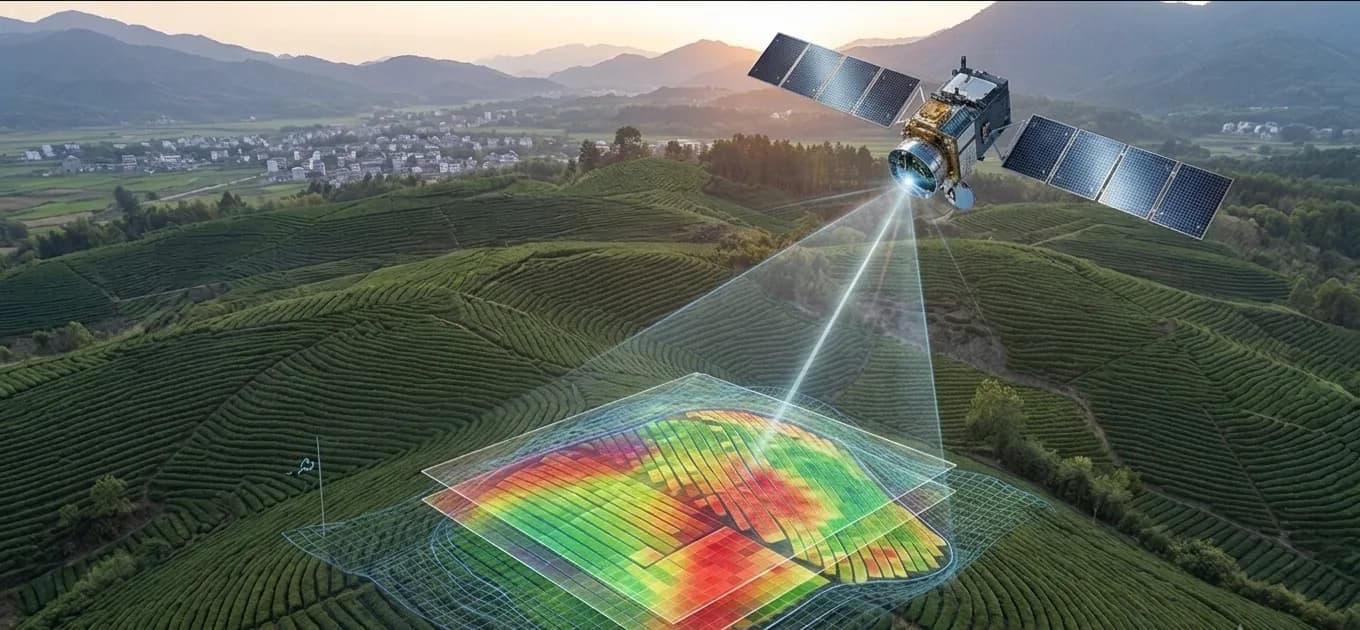
Open and commercial multispectral imagery, processed automatically at every pass.

  • Sentinel-2 and Landsat, 5-day revisit
  • NDVI, NDRE, NDWI and SAVI indices
  • Automatic cloud masking

IoT technology

03

Standalone stations designed for the field: low power, long range, low maintenance.

  • Soil moisture probes at several depths
  • LoRaWAN and 4G transmission depending on coverage
  • Solar powered, long-duration autonomy

Drone technology

04

The high-resolution complement to satellite, when you need to zoom down to the individual tree.

  • Multispectral and thermal sensors
  • Centimetric resolution, tree counting
  • Scheduled missions and automatic reporting

Vegetation indices

Four indices, four different questions

An index is not a health score: it is a ratio between two spectral bands, sensitive to one specific phenomenon. Using the right one at the right stage avoids most misreadings.

NDVI

Normalized Difference Vegetation Index

Bands
Near infrared / Red
What it measures
Overall canopy density and vigour.
When to use it
Season tracking, broad zoning, spotting a drop. Saturates when the canopy is very dense.

NDRE

Normalized Difference Red Edge

Bands
Near infrared / Red edge
What it measures
Chlorophyll content, hence canopy nitrogen status.
When to use it
Variable-rate nitrogen on cereals and dense canopies, where NDVI no longer discriminates.

NDWI

Normalized Difference Water Index

Bands
Near infrared / Shortwave infrared
What it measures
Water content of leaves and canopy.
When to use it
Early water stress detection, before vigour visibly drops.

SAVI

Soil Adjusted Vegetation Index

Bands
Near infrared / Red, soil corrected
What it measures
Vigour corrected for bare-soil influence.
When to use it
Row-planted perennials and early growth stages, when soil fills much of the pixel.

All four indices are computed at every pass and kept in the field’s history.

Technical building blocks

The technical chain, block by block

What the words “AI”, “big data” and “GIS” actually cover inside the RoboCare platform.

Convolutional networks segment the drone orthomosaic to isolate each canopy, then classify its condition. On olive groves this counts the trees, identifies empty planting spots and flags crowns whose signature suggests peacock spot. A disease hypothesis always comes with a confidence level, never as a closed diagnosis.

Time-series models learn the normal trajectory of a field for a given crop-climate pair and flag deviations that fall outside the expected interval. Yield models, trained on histories declared by partner farms, produce a per-zone estimate several weeks before harvest.

A Sentinel-2 scene weighs several hundred megabytes and covers 110 km across. Processing is split into parallel tasks, rasters are stored in a cloud-optimised format so only the useful window is read, and indices are pre-computed so opening a field stays instant.

Fields, indices, alerts and reports are available through an authenticated REST API with pagination and webhooks. Cooperatives use it to feed their own management systems; equipment makers, to pull a variable-rate map their spreader console can read.

Imported outlines are reprojected automatically to a shared reference system, with local projection handling and topological validation. Variable-rate maps are exported in the formats expected by on-board consoles and RTK GPS receivers.

LoRaWAN for remote sensors — kilometres of range at minimal power draw — 4G where coverage allows and throughput is needed, MQTT to push frames to the ingestion gateway, and local storage on the station whenever the network drops.

Processing chain

From raw data to the agronomic instruction

Step 01

Acquisition

Satellite images, sensor readings, drone flights and weather data aggregated field by field.

Step 02

Pre-processing

Cloud masking, atmospheric correction and vegetation index computation.

Step 03

Inference

Stress zone segmentation, disease detection and water requirement forecasting.

Step 04

Delivery

A dated, quantified instruction sent by email, SMS or WhatsApp in FR, EN or AR.

Frequently asked questions

Understanding the technology

What satellite monitoring, AI, and agricultural drones actually cover at RoboCare.

What is precision agriculture?

Precision agriculture manages a field zone by zone instead of treating it as one uniform block — because soil, water, and vigor rarely are. It combines satellite and drone imagery, IoT soil sensors, and AI analysis to map exactly where a crop needs water, nitrogen, or attention, and where it doesn’t. The result is targeted action instead of blanket treatment: inputs go where they’re useful, not everywhere at once.

How does satellite monitoring improve farming?

Satellite monitoring gives farmers a view of the entire field every few days, without walking it. RoboCare processes Sentinel-2 and Landsat imagery automatically at each pass, masking clouds and calculating vegetation indices like NDVI and NDRE to reveal vigor changes before they’re visible to the eye. Three to five years of archived imagery let farmers compare the current season against past ones from day one.

How can farmers detect crop stress early?

The earliest signs of water or nutrient stress show up in the near-infrared spectrum before leaves visibly wilt or yellow. RoboCare’s NDWI index flags water stress specifically, ahead of a visible drop in vigor, while NDRE tracks chlorophyll and nitrogen status in dense canopies where NDVI saturates. Combined with IoT soil moisture probes, this gives an early warning days to weeks before symptoms are visible on the ground.

How does RoboCare analyze satellite images?

Every satellite pass is processed automatically: cloud-covered pixels are masked out, and the remaining imagery is converted into vegetation indices — NDVI, NDRE, NDWI, and SAVI — at 10-meter resolution from Sentinel-2. Each index is stored in the field’s history, so a farmer sees not just today’s snapshot but a trend line across the season and against previous years, with zones of concern highlighted automatically.

What are NDVI and NDRE indices?

NDVI (Normalized Difference Vegetation Index) measures overall vegetation density and vigor from near-infrared and red light — useful for season-long tracking and zoning, though it saturates in very dense canopies. NDRE (Normalized Difference Red Edge) reads chlorophyll and nitrogen status instead, using the red-edge band, and stays accurate exactly where NDVI stops discriminating — making it the index RoboCare uses for nitrogen modulation on cereals.

How does AI help agricultural decision-making?

RoboCare’s AI models are trained on Mediterranean time series, not imported from another climate, and retrained every season. They handle three tasks: image segmentation to delimit stressed zones within a field, yield forecasting per crop, and disease classification from field photos. Instead of raw index values, a farmer receives a direct recommendation — irrigate this zone, treat that one — reducing analysis to a decision.

Does RoboCare provide drone inspection services?

Yes. RoboCare’s agricultural drones carry multispectral and thermal sensors for centimeter-resolution inspection — the level of detail satellite imagery can’t reach. Missions are programmed and flown over a field or orchard, and results are compiled automatically into a report per zone, including individual tree counts where relevant. Drone inspection complements satellite monitoring rather than replacing it: satellite for the whole season, drone when a closer look is needed.

How can drones detect crop problems?

Flying much closer to the canopy than a satellite, RoboCare’s drones capture centimeter-resolution multispectral and thermal imagery that reveals individual trees or plants under stress — not just a general zone. Thermal sensors pick up canopy temperature differences linked to water stress before wilting is visible, while multispectral bands support the same vegetation indices used at satellite scale, at a resolution fine enough to isolate a single affected tree.

Does RoboCare use drones for fertilization and spraying?

RoboCare’s drone missions map exactly which zones of a field need nitrogen or treatment, based on NDRE and thermal readings — and that map can guide targeted, variable-rate fertilization and spraying instead of a uniform pass over the whole field. Inputs go only where the data shows they’re needed, which is the same principle behind RoboCare’s satellite-based nitrogen modulation on cereals, applied at drone resolution.

What are the advantages of drone-based agricultural treatments?

Drone-based treatment targets exactly the zones that need it, based on a real map rather than a uniform application — reducing the volume of fertilizer or crop-protection product used, and its cost, without under-treating the areas that actually need it. Missions are programmed and flown quickly over a field or orchard, faster than manual scouting, and the resulting maps stay in RoboCare’s platform for the next season’s comparison.

Let's talk about your fields

Ready to see your fields differently?

Create a free account or book a walkthrough with a RoboCare agronomist. We reply within 48 hours.

Create an account